Boxplot is too narrow when used with facetting #2290
Description
Boxplot is too narrow when used with faceting, and this issue never appears in 2.2.1 release.
I encountered this issue with a dataset similar to below:
va <- c(rnorm(10, 1, 1))
vb <- c(rnorm(10, 3, 1))
vc <- c(rnorm(10, 2, 1))
vd <- c(rnorm(10, 3, 1))

tf <- data.frame(
                 factor1 = rep(c('A', 'B'), each = 20,times=4),
                 factor2 = rep(c('A', 'B', 'A', 'B'), each = 10, times = 4),
                 factor3 = rep(c(LETTERS[1:4]), each = 40),
                 value = rep(c(va, vb, vc, vd), times = 4)
                 )
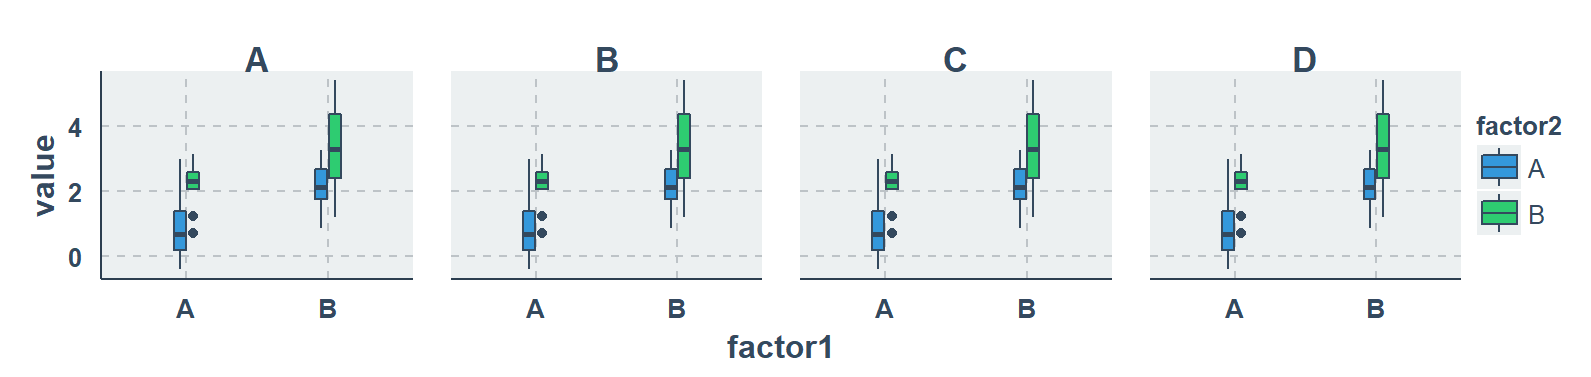
The plot below is with a discrete x-axis and a continuous y-axis:
ggplot(tf, aes(factor1, value)) +
    geom_boxplot(aes(fill = factor2)) +
    facet_wrap(~factor3, ncol = 2) +
    theme(aspect.ratio = 2 / 3)
And the plot produced:

The width of each boxplot is too narrow. This also happens when I use facet_grid():
ggplot(tf, aes(factor1, value)) +
    geom_boxplot(aes(fill = factor2)) +
    facet_grid(.~factor3) +
    theme(aspect.ratio = 2 / 3)
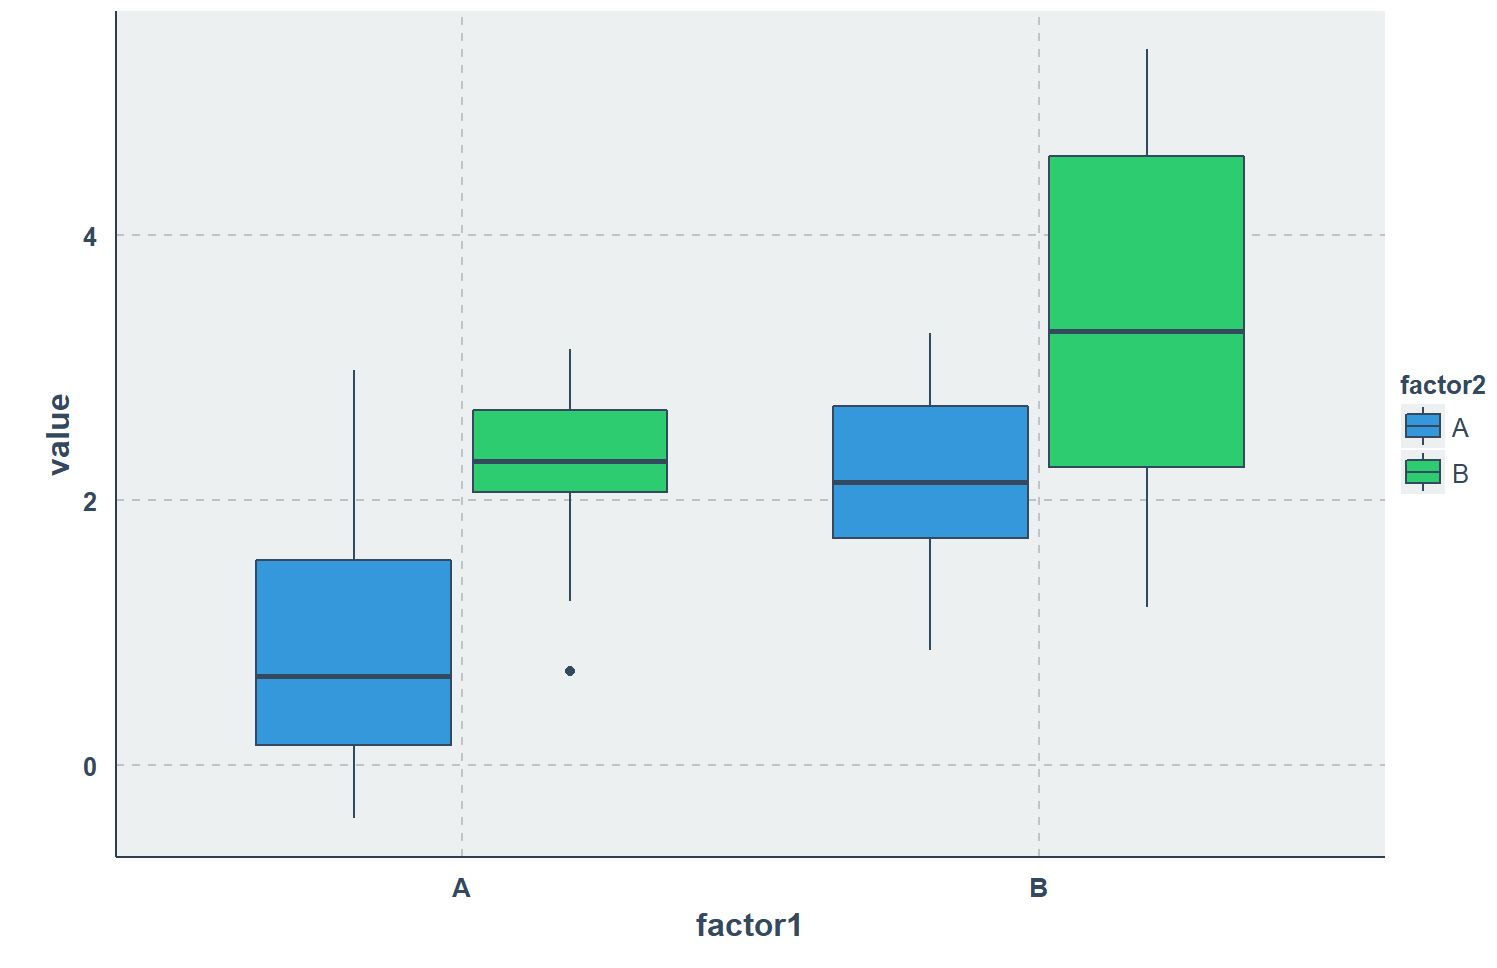
If I remove facet_wrap(), the plot looks good:
ggplot(tf, aes(factor1, value)) +
    geom_boxplot(aes(fill = factor2)) +
    theme(aspect.ratio = 2 / 3)
If I increase width, the boxes are off the ticks:
ggplot(tf, aes(factor1, value)) +
    geom_boxplot(aes(fill = factor2), width = 2) +
    facet_wrap(~factor3, ncol = 2) +
    theme(aspect.ratio = 2 / 3)

I don't know if it is a bug, or something internal changed from the 2.2.1 release. My original code works fine on release version, but has this issue on the dev version.